IMI Sensors technical support is unmatched. Years of application engineering experience have yielded technical tips to help maintenance teams to protect their critical machinery against unscheduled downtime. Check them out!
Understanding Current Output Signals- RMS, Peak and True Peak
In process monitoring applications where a continuous 24/7 signal is needed for recording and trending by a PLC, DSC or SCADA system, a vibration transmitter with a constant 4-20mA output signal is ideal. But what exactly does that 4-20mA signal represent? Because the foundation of most vibration transmitters is the same or similar sensing element as found in a typical accelerometer, the transmitter converts the output from an AC raw voltage signal to a current signal internally. During the course of that conversion, the current output may be scaled in terms of one of three values:
- RMS (root mean square)
- Peak
- True Peak
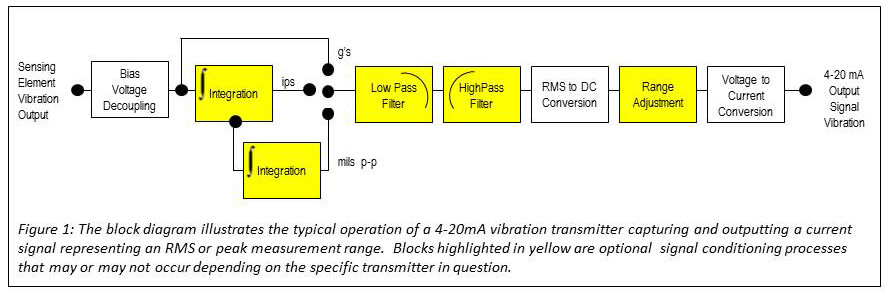
As referenced above, the core of most vibration transmitters is the same sensing element as at the core of an accelerometer. That element measures the vibration and subsequently outputs an AC dynamic voltage riding of top of the DC bias voltage of 8-12 VDC. That output signal then goes through a series of electronic alterations before ultimately being outputted as a 4-20mA current signal.
- DC bias voltage is decoupled from the AC signal voltage.
- Measurement range of the AC voltage signal may stay in acceleration or it may be changed to velocity via integration or displacement via double-integration.
- AC signal has low and high frequency data filtered out based on filter setpoints.
- AC voltage signal is converted into a DC voltage signal.
- DC voltage signal may be scaled if different minimum and maximum measurement range values are available.
- DC voltage signal is converted to a 4-20 mA current signal.
The above-described signal conditioning process is illustrated below in Figure 1.
Within the signal conditioning process described above, the conversion of the AC voltage signal to a DC voltage signal is the primary determinant of the resulting current signal’s scaling.
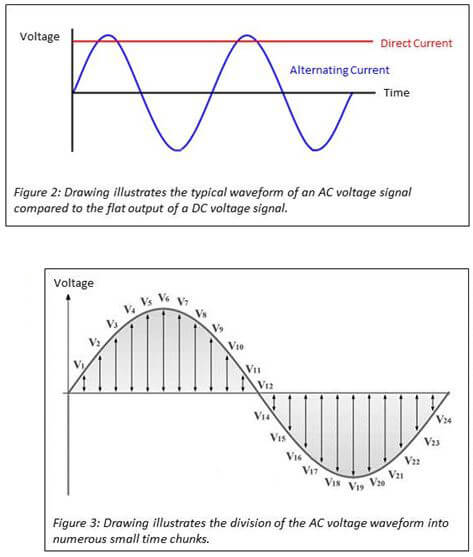
To begin this in-depth look at this AC to DC conversion process, let’s begin with a review of alternating current (AC) and direct current (DC) voltage signals. See Figure 2.
- Alternating current (AC) is an electric current in which the flow of electric charge periodically reverses direction.
- Direct current (DC) is an electric current in which the flow of electric charge is only in one direction.
Converting an AC signal to a DC signal is not as simple as averaging the individual AC signal values. For sine waves with equal positive and negative half cycles, this averaging would result in a non-valuable measurement of zero. Instead, in order to achieve a useful result, a weighted average termed the Root Mean Square (RMS) voltage of the AC signal is calculated. The resulting value is the equivalent DC voltage output that would produce the same amount of power dissipation (ie. heat) in a resistive load as the corresponding AC voltage signal.
To compute the RMS voltage of any AC signal:
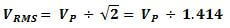
- Divide one cycle (ie. one positive and one negative half cycle) of the AC waveform into many slices, each small enough to represent a constant voltage during the time period. See Figure 3.
- Square each of those individual constant voltages. This squaring of each individual voltage converts all voltages, regardless of whether positive or negative originally, to positive values.
- Take the average (mean) of all those squares.
- Take the square root of the mean.
For a simple sinusoidal wave, the calculation process is much simpler than the one described above as the waveform has equal positive and negative half cycles. As a result, the RMS voltage and peak voltage values in the negative and positive half cycles consistently have the same amplitude. Peak-to-peak voltage data consistently has equal contributions from the positive and negative half cycles on the waveform. For an illustration of the relationship between RMS voltage, peak voltage and peak-to-peak voltage, see Figure 4.
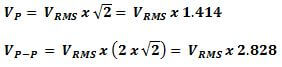
RMS voltage (VRMS) can be calculated by multiplying the peak voltage (VP) by the square root of two. The calculation is expressed in a formulaic description below.
From the RMS voltage value, both peak voltage (VP) and peak-to-peak voltage (VP-P) can be calculated based on the below equations. As with the above RMS voltage equation, the below equations can only be used if the waveform in a sinusoidal wave.
As a result of the AC to DC conversion using the root mean square (RMS) method, all frequency data has been lost and the peaks of the AC signal have been completely smoothed out regardless of whether reviewing the equivalent RMS or peak DC voltage (and subsequently current) signal. This makes the resulting 4-20 mA signal ideal for long-term process monitoring but not for in-depth analysis. See Figure 5 and 6 for illustrations.
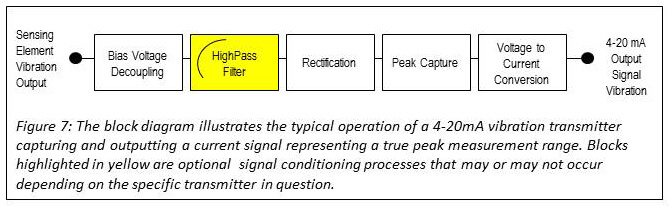
For applications where true peak data needs to be monitored with a 4-20 mA signal, the AC voltage signal is converted into a DC voltage signal via the rectification process rather than the RMS process. The rectification process converts all negative half cycles of the waveform to positive half cycles of equivalent amplitude. The peak capture function then reviews all positive half cycles during a given time period and captures the highest amplitude as the true peak value.
The above-described signal conditioning process is illustrated below in Figure 7.
A 4-20 mA transmitter converts an accelerometer-type voltage output into a current output through the use of a multi-part electronics process. During the AC to DC voltage conversion portion of the process, all frequency data is eliminated from the signal. As a result, the current output cannot be used for in-depth vibration analysis, but is ideal for process monitoring applications where a continuous 24/7 signal is needed for recording and trending by a PLC, DSC or SCADA system.